Project Goals
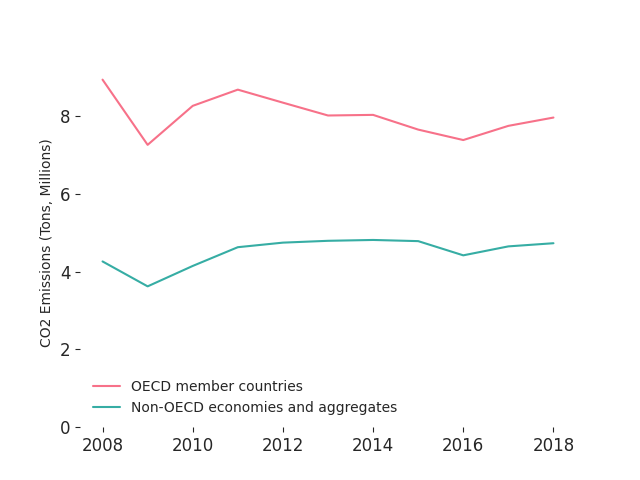
- Measure the carbon footprint of trade activity between OECD and non-OECD countries.
- Compare import- and export-related emissions across country groups.
- Turn complex environmental data into a clearer policy-facing story.
Analytical storytelling
A visualization and policy-oriented analysis of carbon emissions embodied in international imports and exports, with emphasis on OECD and non-OECD comparisons.
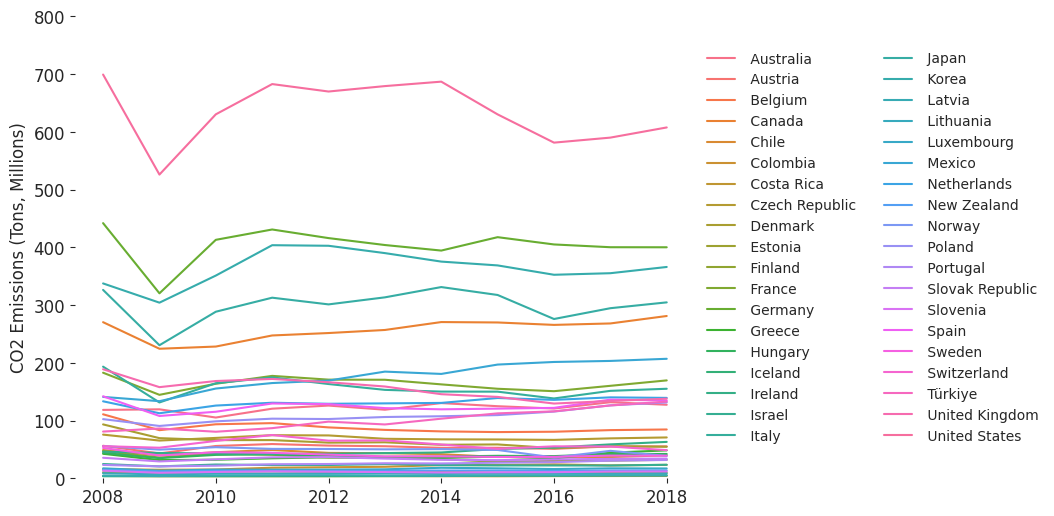
The analysis uses OECD greenhouse-gas emissions data, Global Carbon Project context, and country-level emissions indicators from 2008 to 2018.
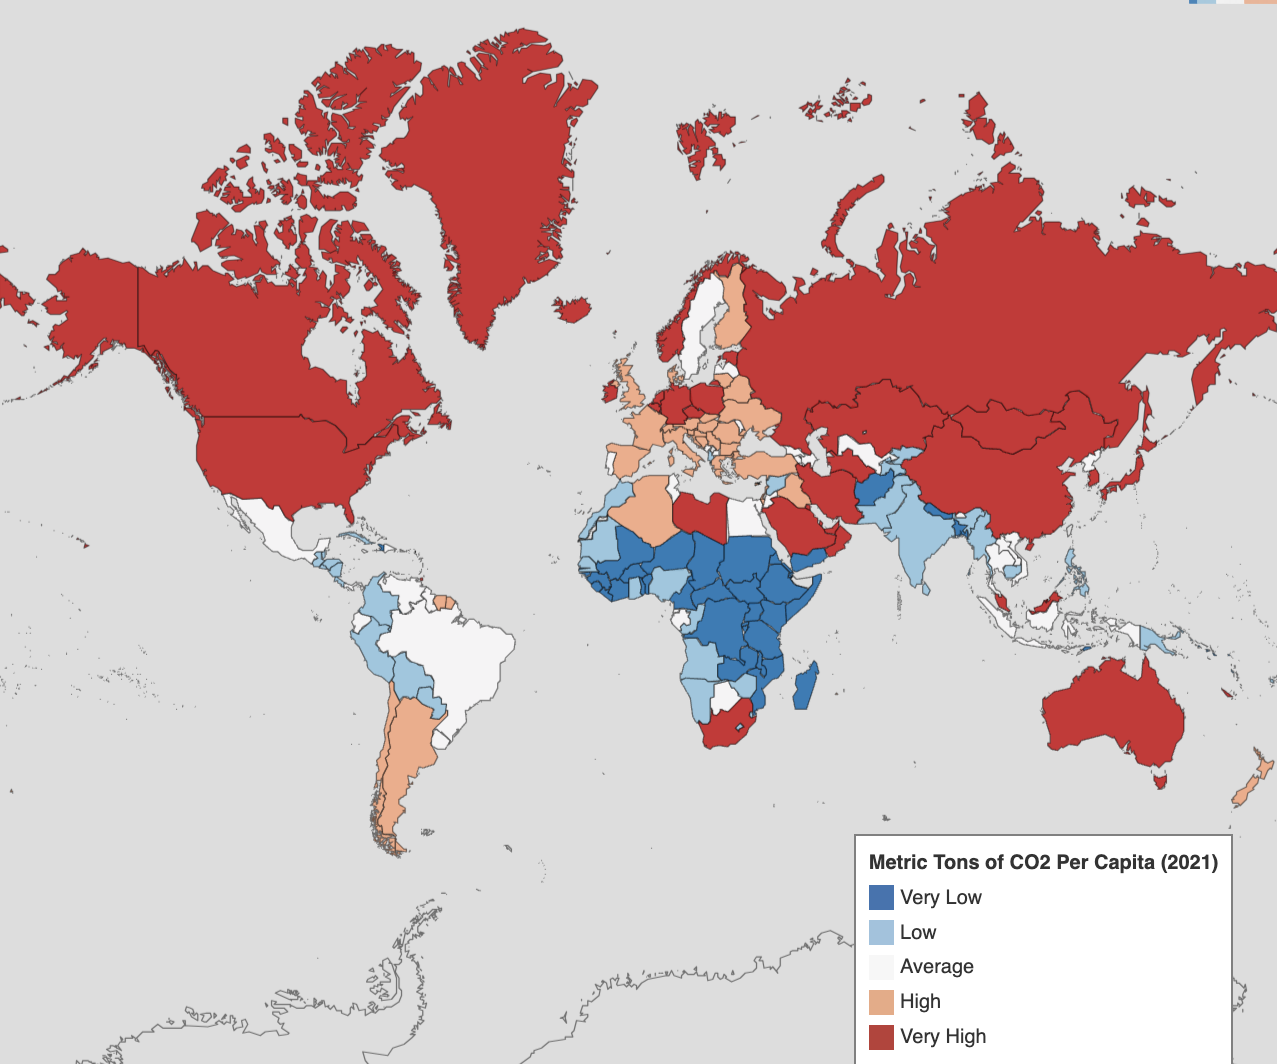
Inputs included territorial CO2 emissions per capita, gross emissions embodied in imports and exports, and overall country-level emissions.
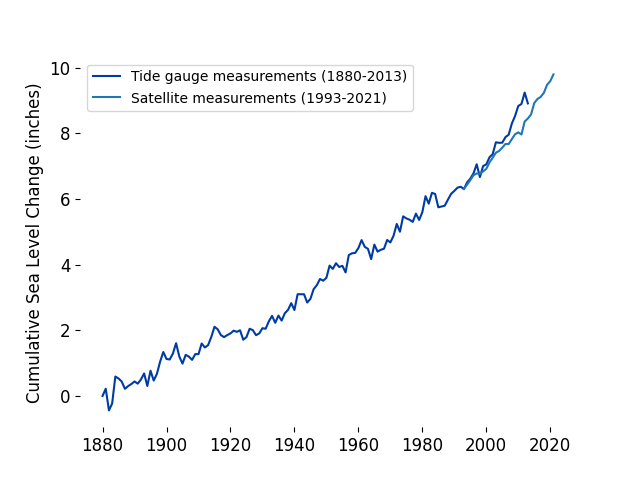
The project is structured as sustainability analytics rather than prediction. It compares country groups, separates import- and export-related emissions, and places trade emissions beside broader climate indicators such as CO2 concentration, surface temperature, and sea-level trends.
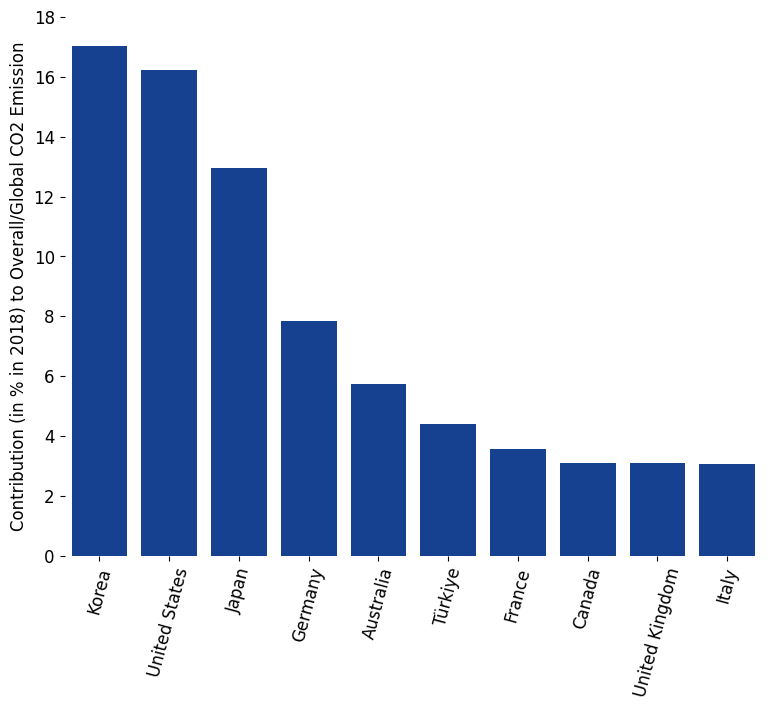
The strongest portfolio value is the translation from raw environmental indicators into charts a policy or business audience can scan quickly.
The analysis is evaluated through consistency, comparative clarity, and source-backed visualization rather than model accuracy. It does not claim causal attribution between individual trade flows and climate trends.
A stronger next pass would standardize time windows across all charts, add uncertainty notes, and connect country-level totals to per-capita and sector-level breakdowns.
This project is less about one model and more about judgment: selecting the right comparisons, making the story legible, and connecting data visualization to a real policy conversation.