Optimization and public policy

Washington State Algorithmic Redistricting

A decision-analytics project that frames redistricting as an optimization problem, balancing population distribution, adjacency, and representation-oriented constraints.

Linear programming US Census data Geographic constraints Decision analytics

Project Goals

  • Develop an optimized redistricting plan while maintaining balanced district populations.
  • Use constraints to reduce arbitrary decision-making in the districting process.
  • Incorporate adjacency, demographic, and population-balance considerations.

Method

The project uses 2020 Census data for Washington State and builds a county adjacency matrix to represent geographic restrictions.

Linear programming was then used to assign counties into districts while respecting allocation rules, county minimums, demographic variables, and manually defined geographic cut constraints included in the assignment model.

Result

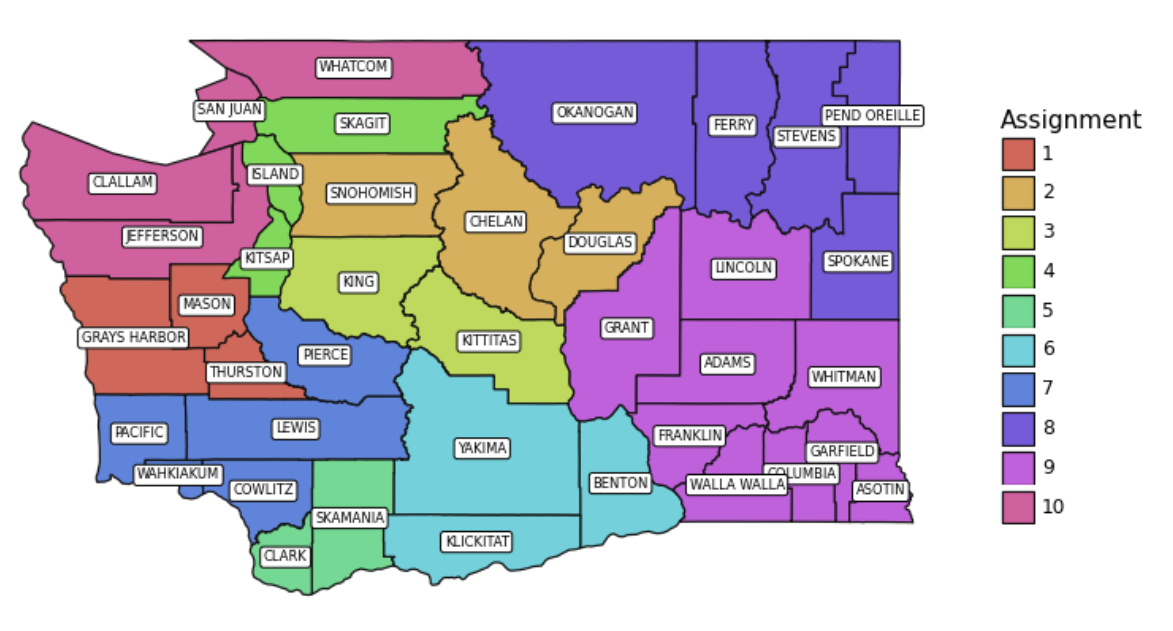
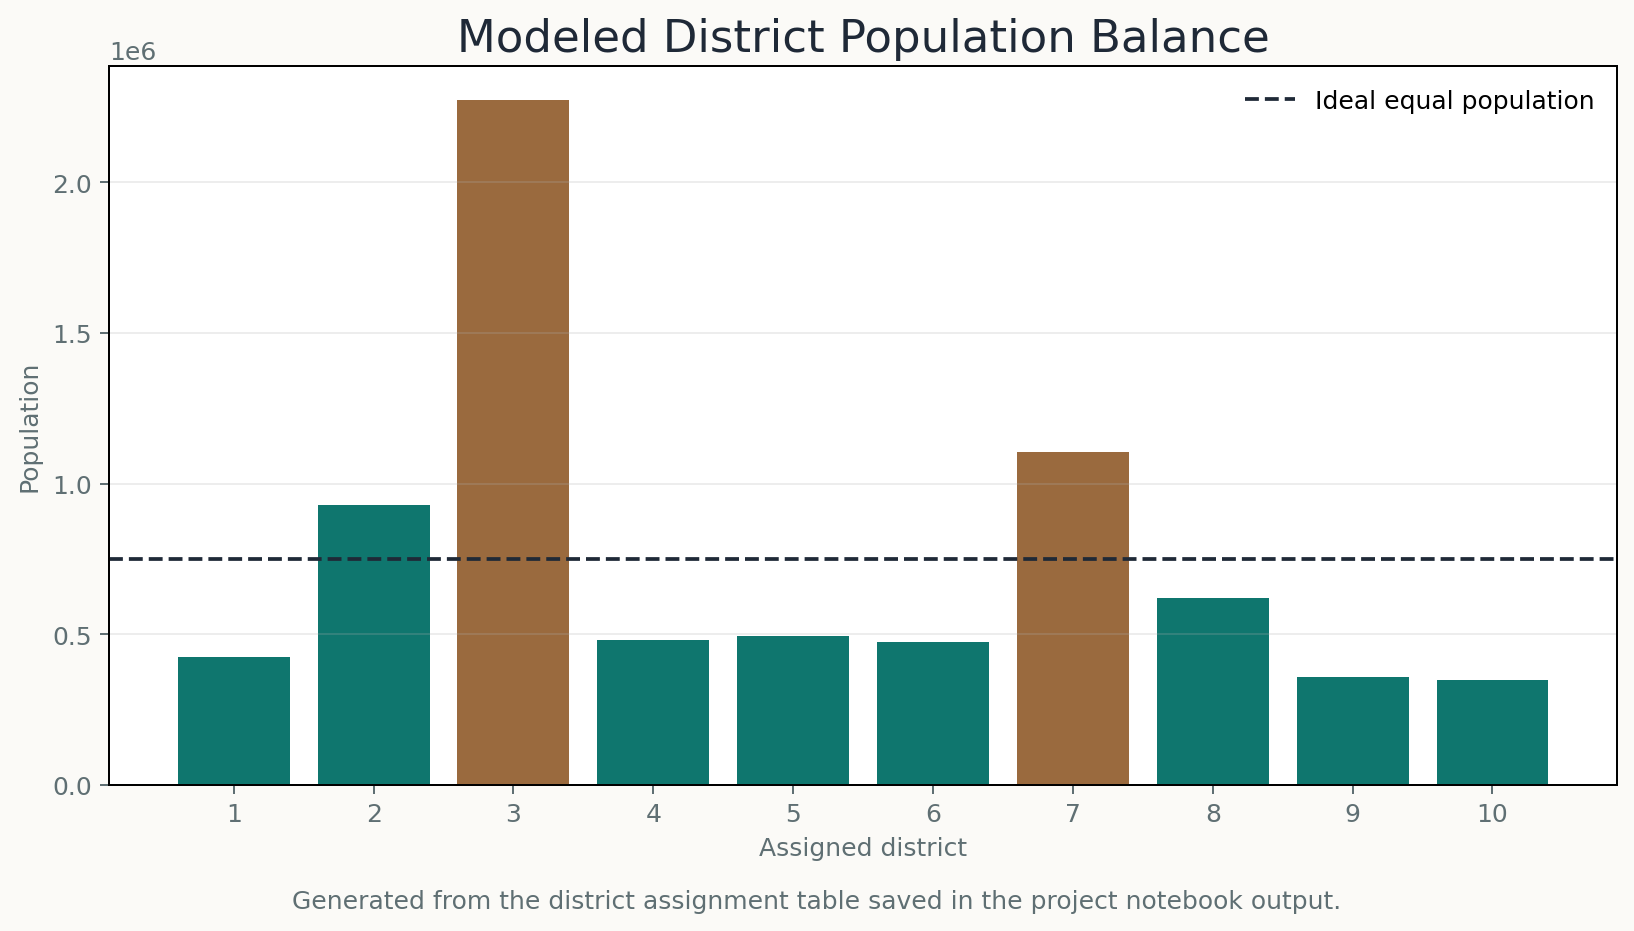
The model generated 10 assigned districts and an interactive map. The population-balance chart also makes the limits of the simplified county-level model visible: district populations are not perfectly balanced, and King County dominates one assignment because the model allocates at county granularity.

That honesty helps the project read as decision analytics rather than a polished political map.

Evaluation Framing

  • Population balance was reviewed against an equal-population target across 10 districts.
  • County adjacency and geography cuts constrained which counties could plausibly share districts.
  • Demographic proportions were inspected after assignments to understand representation tradeoffs.

Limitations and Next Steps

  • County-level districting is a coarse approximation; real redistricting usually needs precinct or census-block granularity.
  • The model uses simplified constraints and should not be interpreted as a legally compliant districting plan.
  • A stronger next pass would add compactness metrics, contiguity enforcement, Voting Rights Act review, and sensitivity analysis across objective choices.

What It Shows

  • Translation of a civic problem into an optimization model.
  • Use of real demographic and geographic constraints.
  • Decision analytics beyond standard prediction tasks.

Visual Evidence

Washington State redistricting map with modeled district boundaries
Washington State map from the project output.
Bar chart of modeled district populations compared with equal population target
Generated district-population balance chart from the saved notebook result table.
Conceptual flow diagram for the redistricting optimization model
Conceptual optimization workflow showing inputs, constraints, objective, and outputs.